Long time, no talk! Boy have I been busy outside of trading from starting a new contract software position at Intuit, dealing with and resolving a psychological risk management issue (more on this in the future), and finding out I had cellulitis this past Labor Day weekend thanks to landing on a stingray in the shorebreak at my main surf break. Doc says the meds I’m taking should heal me within the next week or so!
But enough about me!
I hope you have been well, and enjoyed the long holiday weekend with your friends and family. This week I’m back with my stock market reviews as volatility looks to continue in the market thanks to the US-China ongoing trade war, President Trump’s tweets about the US-China Trade War and stance on Fed Chair Powell’s monetary policy, fresh new economic data and if the Federal Reserve is to cut interest rates.
Before I dive into the summary for the week, let’s all please pray for our family and friends in Florida and the Bahamas that are being affected by Hurricane Dorian. Please everyone stay safe and take care of each other!
New round of US tariffs on China to start the week; 2-10 year yield inversion
The trade war between the two biggest economies in the world, US and China, continues as ES (S&P500) futures dropped below 2,900 shortly after yesterday’s open thanks to a fresh round of tariffs on roughly 15% of goods imported by China (> $100 billion). This latest round of US tariffs hit about 2/3 of the consumer goods the United States imports from China, which could directly impact US economy’s main driver: consumer spending. Companies that rely on importing their products from China will be forced to pay more for the same. However, the end consumer might be the one paying for the increase.
Yesterday’s new round of US tariffs on China are not the end; even more tariffs loom on the horizon on December 15th when the Trump administration is scheduled to impose a second round of 15% tariffs this time on roughly $160 billion of imports. The president has also announced that existing 25 percent tariffs on a separate group of $250 billion of Chinese imports will increase to 30 percent on Oct. 1. If these duties take effect, virtually all goods imported from China will be more expensive, especially all major Apple products.
China has retaliated by imposing tariffs on $75 billion of US goods imported into the country. Donald Trump says negotiations will resume in US capital this month but China yet to confirm such a plan.
My general consensus on the trade war is that China and President Trump will go back and forth with new tariffs and “resolutions” until the 2020 election. By that time I believe that President Trump plans to resolve the situation entirely to boost his candidacy for re-election. Obviously this is just my opinion and anything can happen, but if you have ever read Trump’s book, “The Art of the Deal”, it just makes sense from a strategic standpoint. Until then I think the market will continue to have both positive and negative reactions to US-China Trade War headlines as long as the market doesn’t sell off for another underlying, economic reason.
*Keep zerohedge, and President Trump's Twitter open at all times. The best way to get notified for all high impact news events is using https://www.tradethenews.com/, or a similar service that is completely free which I use https://www.financialjuice.com. Be vigilant y'all.
Besides the US-China tariffs, I would continue to keep an eye on the inversion of the 2 and 10 year yields since the inversion is nearing the -0.14 to -0.16 lows that preceded the 2008/09 financial crash as seen in the chart below. The spread can stay below 0.00% for awhile before fear of a recession becomes real. So far the market has shrugged off this recession indicator.
Something else that concerns me is the huge divergence between equities and long-term US government bonds. Based on historical data it looks like either the equity market will have to decrease, bonds to increase, or both to stabilize. If equities were to head towards long-term US government bonds, we are talking about a 40-45% drop…wowzers.
Things to Watch this Week
Economic Data Releases
*Note all times in PST; all events are U.S. unless otherwise stated.
Note crude oil inventories are scheduled on Thursday at 8am PST.
The big economic data releases to pay attention to are ISM Manufacturing on Tuesday, and Employment numbers on Friday.
US Retail Earnings: MDB, CLDR, WORK, ZM
Weekly Futures Levels
ES - S&P500
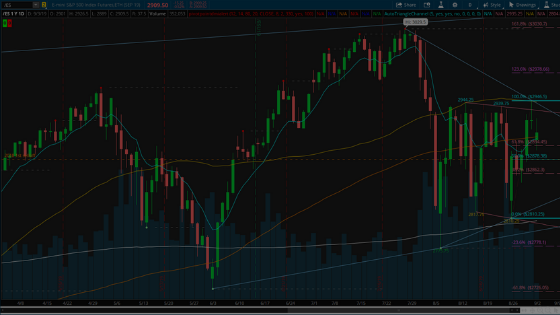
Price is now near the upper part of the consolidation area which is between 2945 (50 day sma) and 2810 (200 day sma). A lot of selling volume came in on Friday on the failed break higher above 2940 resistance. Current price action is about 1/3 back from the most recent measured move with support below at 2878-82, 2850 and the lower trendline/200 day sma. We may continue to consolidate in this range unless some type of positive news can cause buyers to step in above 2930 potentially bringing ES to 2978 and eventually back above 3,000 again. Note that besides Friday’s high, price has been making lower highs and lower lows on the daily.
NQ - Nasdaq
NQ is very similar to ES with price rejecting the 50 day sma. Price pulled back to 7,580 support almost 50% retracement from the most recent measured move. If this low does not hold, I would look for the bulls to defend 7,500 otherwise a stepper pull back could bring price to continue the downtrend consolidation with first stop at 7,420-30 level. Ultimately for the bulls I’m looking for price to break above 7,700 and momentum to be sustained through 7,790 to break out of this consolidation.
YM - Dow Jones Industrial Average
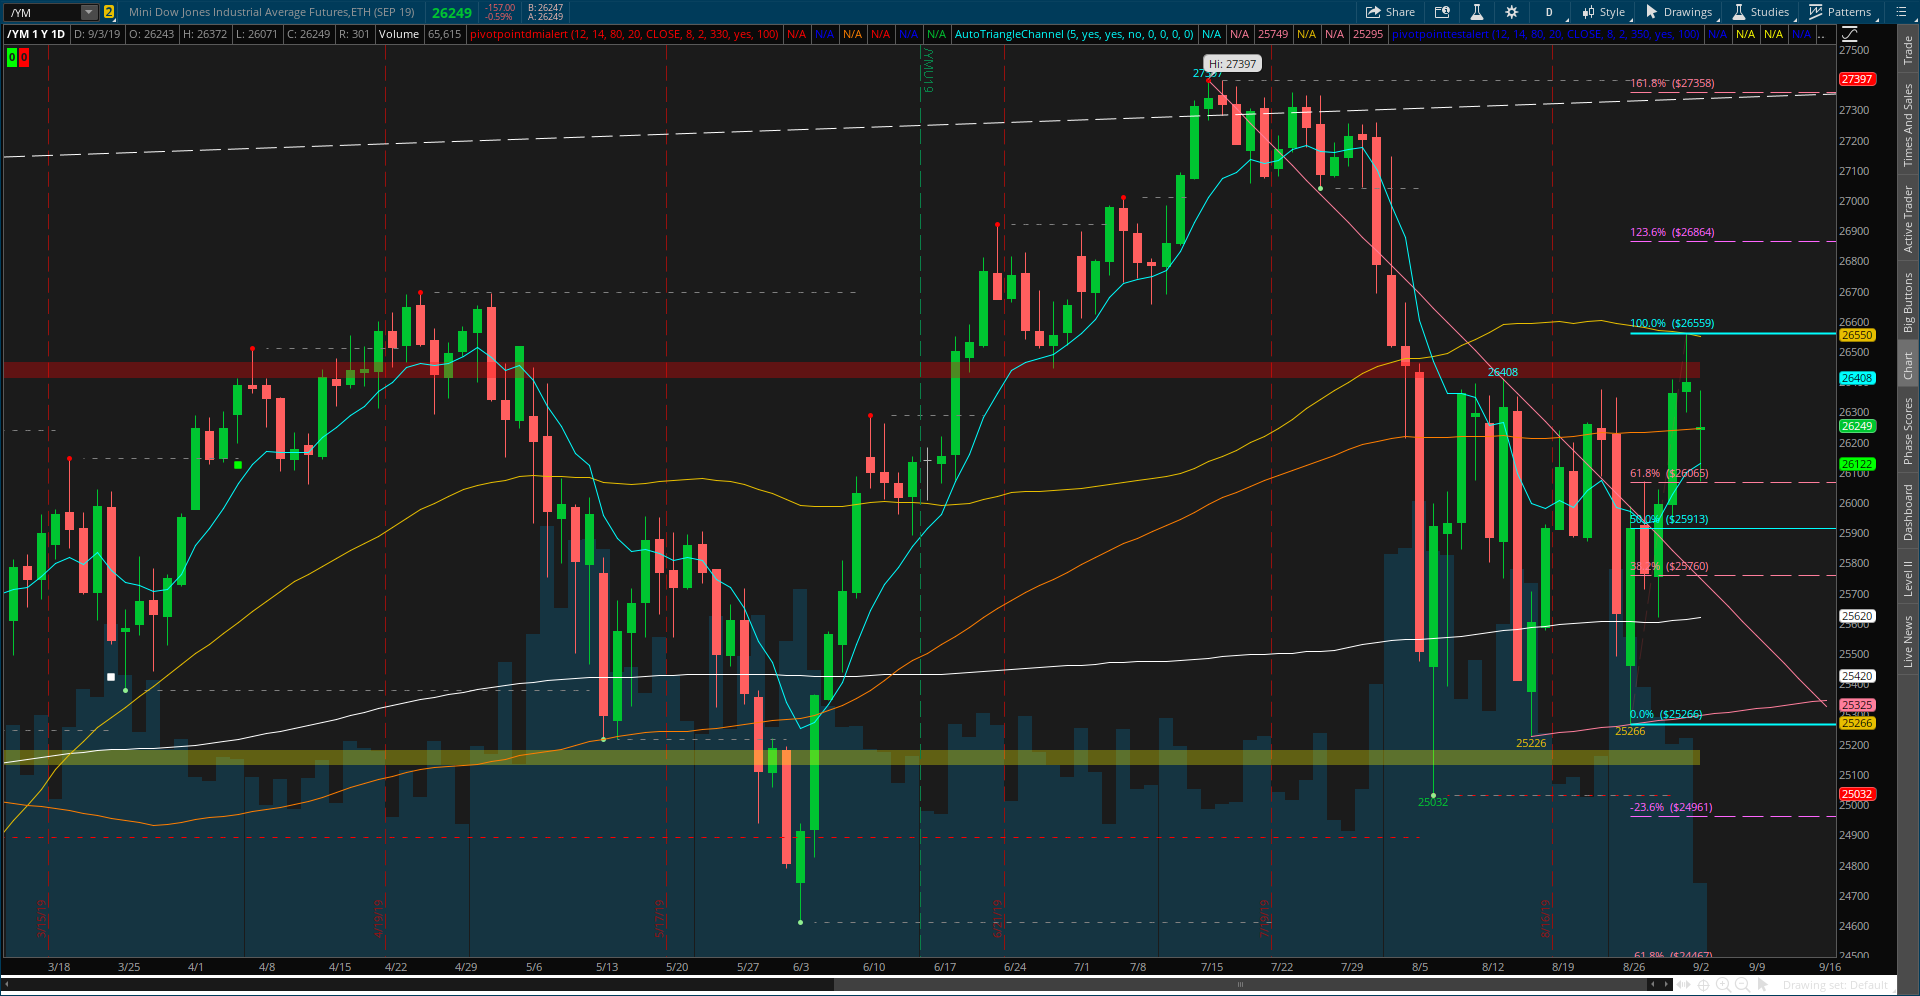
Again very similar to ES and NQ, the DJIA needs to clear 26,400 to the upside and ultimately the 50 day sma. Downside support is 26,065 (1/3 back), 25,900 and 25,760 all the way to the 200 day sma (25,620).
RTY - Russell (small cap)
The RTY is in a solid bearish trend and needs to be watched closely on which direction she goes as the bigger indices will more than likely follow suit. If price can’t rally to break the bearish market structure (above 1,510, and the 200 and 50 day smas), equities may be in for a slip lower. 1,465 is critical support lower that needs to hold otherwise the RTY will more than likely continue lower to a new lower low.
GC - Gold
Gold is in a solid bullish trend, but it looks like it might be time for a pullback to test support. Last week price hit a huge resistance level on the monthly timeframe 1,560-65 area. Levels that I’m looking for a pull back include 1,495-1,500, and the 50 day sma + lower trendline. If for some reason gold sells off further, a retest of 1,440 would be a nice buying opportunity.
FYI: Seasonality for buying gold tells me that July through September are the best months to purchase gold.
CL - Crude Oil
Similar to RTY, Crude Oil is in a bearish trend. However, all eyes are on Hurricane Dorian to see how price reacts. Right now if crude oil can hold this lower trendline and 1/3 back on the daily (~54.50), we might see price rally back up towards the 50 and 200 day smas and upper downtrend line. If support fails, back down to $53 we go to test support and potentially lower to 51-52. Crude oil inventory is this Thursday so definitely something to watch if you trade CL.
Enjoy the rest of the weekend, and have a wonderful green week trading!


