Happy Sunday to you! Markets finally broke out of Augusts ~5% consolidation between 2,800 and 2,945 (S&P 500 futures) to the upside closing the week at 2,983 thanks to positive trade hype that US-China trade talks are now going well again, and with the possibility of both countries continuing negations later on this month. Donald Trump tweeted this a day before markets turned bullish:
We are doing very well in our negotiations with China. While I am sure they would love to be dealing with a new administration so they could continue their practice of “ripoff USA”($600 B/year),16 months PLUS is a long time to be hemorrhaging jobs and companies on a long-shot....
— Donald J. Trump (@realDonaldTrump) September 3, 2019
A part from the renewed optimism from US-China trade negotiations, the US ADP Non-Farm Employment Change and ISM Non-Manufacturing PMI reports on Thursday were beats: 195,000 actual versus 148,000 expected, and 56.4 actual versus 54.0 expected respectively.
Friday consisted of solid employment numbers out of Canada, a slight up tick of +0.1% for US average hourly earnings m/m, and a disappointing Non-Farm Employment Change of 130,000 actual versus 163,000 expected, which will give fuel to the Fed to decrease interest rates. The unemployment rate remains unchanged at 3.7%. Fed Chairman, Jerome Powell, also spoke at an event at the University of Zurich where he mentioned the uncertainty around trade policy is one of the main factors for global slowdown in Germany, China and other European economies. Also, Powell emphasized that he thinks the US economy is in great shape and doesn't anticipate a recession...exactly what you can expect the Chairman of the Federal Reserve to say about the economy.
Renewed optimism across the board.
With all that said, the market is pricing in a rate cut at the next FOMC meeting on September 18. In fact there is a 91.2% chance there will be a rate cute from 2.25% to 2.00% hence why the market has been more bullish than bearish maintaining its long term uptrend.
With all that said let's jump in to what to watch for this week!
Things to Watch this Week
Economic Data Releases
*Note all times in PST; all events are U.S. unless otherwise stated.
The big economic data releases to pay attention to are PPI m/m and Crude Oil Inventories on Wednesday, EUR Monetary Policy Statement and US CPI m/m on Thursday, and finally Retail Sales m/m on Friday. Other market movers include U.K.Average Earnings Index 3m/y on Tuesday morning, and China CPI y/y on Monday afternoon.
Brexit Uncertainty...again
It appears Prime Minister Boris Johnson's efforts to remove Britain from the European Union on October 31 with or without a deal have flopped. The EU market is pricing in a 20 basis point deposit rate cut, and €30 billion per month of quantitative easing pending the Brexit outcome.
Inverted yield curve
In general the spread between the 2 year and 10 year government bonds (10Y - 2Y) is something I will continue to watch. The chart below is self-explanatory:
*Keep zerohedge, and President Trump's Twitter open at all times. The best way to get notified for all high impact news events is using https://www.tradethenews.com/, or a similar service that is completely free which I use https://www.financialjuice.com. Be vigilant y'all.
US Retail Earnings: ACB, KR, AVGO and ORCL
Weekly Futures Levels
ES - S&P500
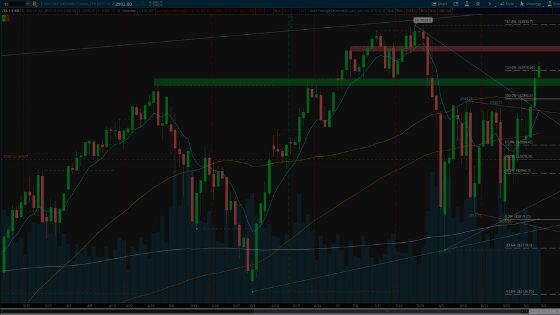
Bulls stepped in on Thursday Globex session to finally push price higher with decent volume above the 2945 resistance and 50 day sma due to news that US and China are expected to resume trade talks towards the end of this month. I would like to see 2960-65 support hold for a move higher to test the lows before the sell off around 3000-3005. Above there new highs are more than likely in the cards. Deep support pull back would be to the 50 day sma and top of the consolidation around 2940-45.
NQ - Nasdaq
NQ also broke out higher of the August consolidation, but ran into resistance around 7,900, which was also the downtrend line from the all-time high failed bull flag. I'm looking for NQ to hold support at 7,790-7,800 for a move higher above 7,900 to test the lows of the previous all-time high candles. If the move up is on strong volume then new highs are in the cards. The market is definitely pricing in a rate cut by the Fed later this month.
YM - Dow Jones Industrial Average
Again very similar to ES and NQ, the DJIA broke higher and looks the most bullish out of the big 3 hitting the first fib target nicely. Overhead resistance sitting at 26,900-27,100, and support at 26,560 to 26,700.
RTY - Russell (small cap)
The RTY rejected the 200 day sma on Thursday and Friday. However the volume was light on Friday on the inside day candle. RTY is predominantly in a bearish trend as seen by the larger down trend channel. There is a lot of resistance for the bulls to clear which starts at 1520-30 (200 day and 50 day smas). If for some reason the bulls come out to play and we see a short squeeze above these resistances, the RTY could make a substantial move higher to 1550+. But there needs to be volume on the move higher. Downside support that needs to hold is 1492-1500 (78.6% fib).
GC - Gold
Last week gold failed to push higher on strong volume above the monthly resistance of 1565. Thursday and Friday's candles were decent down days on strong volume which tells me gold moght continue to slip lower into my support zones as long as equities continue to rise. Levels that I’m looking for a pull back include 1,495-1,500, and the 50 day sma + lower trendline. If for some reason gold sells off further, a retest of 1,440 would be a nice buying opportunity.
FYI: Seasonality for buying gold tells me that July through September are the best months to purchase gold.
CL - Crude Oil
This week crude oil inventories reported a draw again -4.8M actual versus estimated -2.4M which seemed to be built into the market on Thursday's report. However, Friday crude oil recovered on decent volume forming a hammer candle above the 50 day and 200 day smas and right at the main downtrend line. Looking for price to break higher to test 58.00-.40 as long price clears the previous highs from failed breaks higher on strong volume. Support is at 54.75-55.50.
Enjoy the rest of the weekend, and have a wonderful green week trading!

